What is Traffic Calming?
Traffic calming refers to a range of design strategies and measures used to reduce vehicle speeds, improve road safety, and enhance the overall environment for pedestrians and cyclists.
At its core, traffic calming is about shifting streets from being purely vehicle-dominated corridors to shared public spaces where safety and livability come first. Click here to jump to the effictiveness of various traffic calming strategies.
The Problem It Solves
Modern road design, especially in urban and suburban areas, often encourages:
- Higher driving speeds
- Cut-through traffic in residential neighborhoods
- Unsafe conditions for pedestrians and cyclists
This leads to:
- Increased crash risk and severity
- Noise and air pollution
- Reduced quality of life for residents
Traffic calming directly addresses these issues by changing driver behavior through design, not just enforcement.
Where is Traffic Calming Most Effective?
Traffic calming is not a one-size-fits-all solution. It is most effective in areas where safety and community experience matter more than vehicle throughput.
Residential Streets


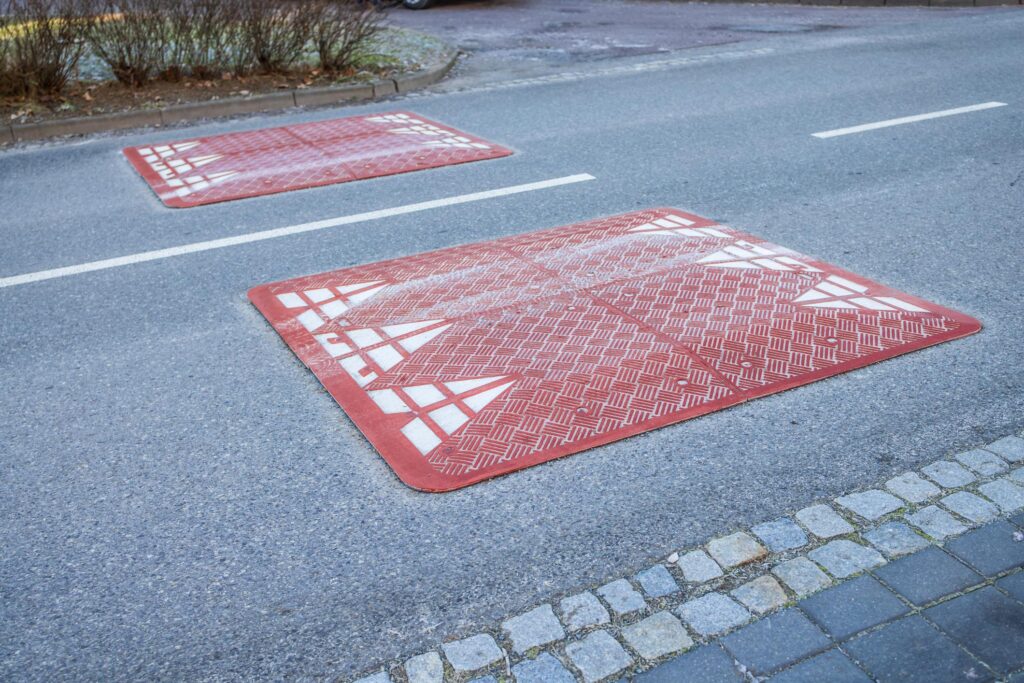
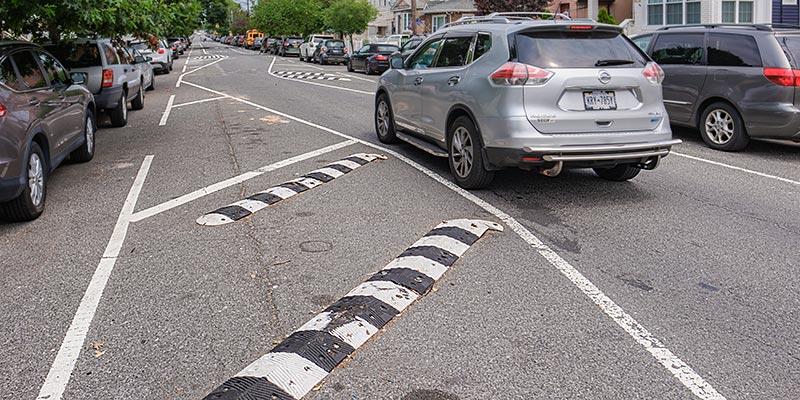
Residential areas are the most common application. Key goals include:
- Reducing speeding
- Discouraging cut-through traffic
- Creating safer environments for children and families
Typical treatments:
- Speed humps/tables
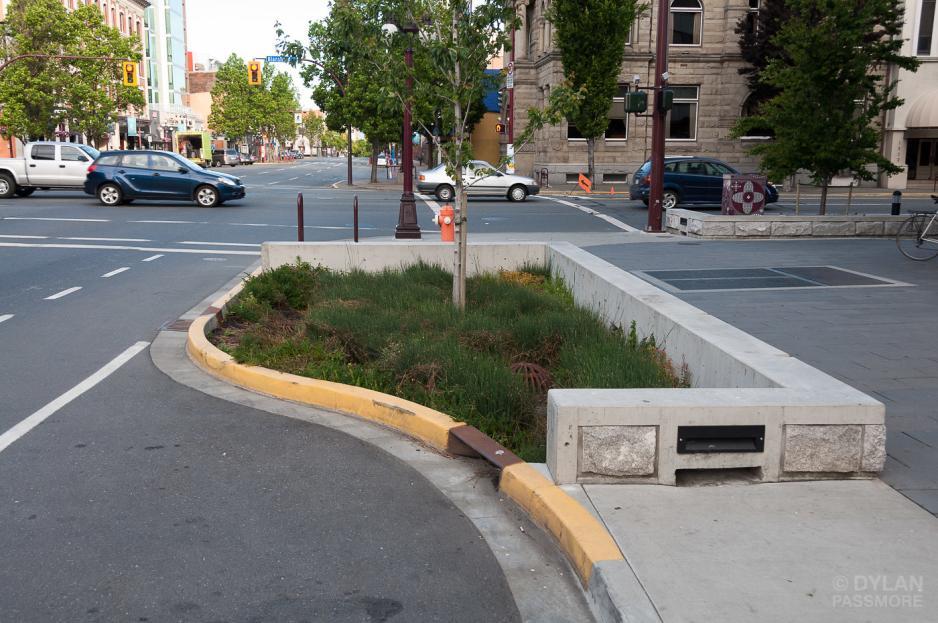
- Chicanes and curb extensions
- Mini roundabouts
School Zones

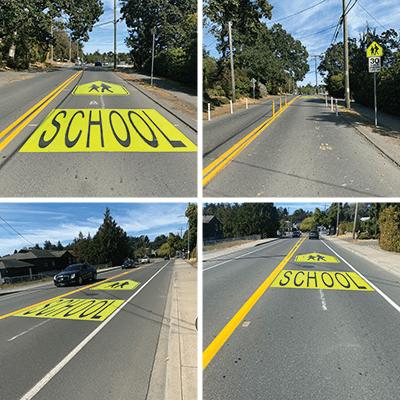
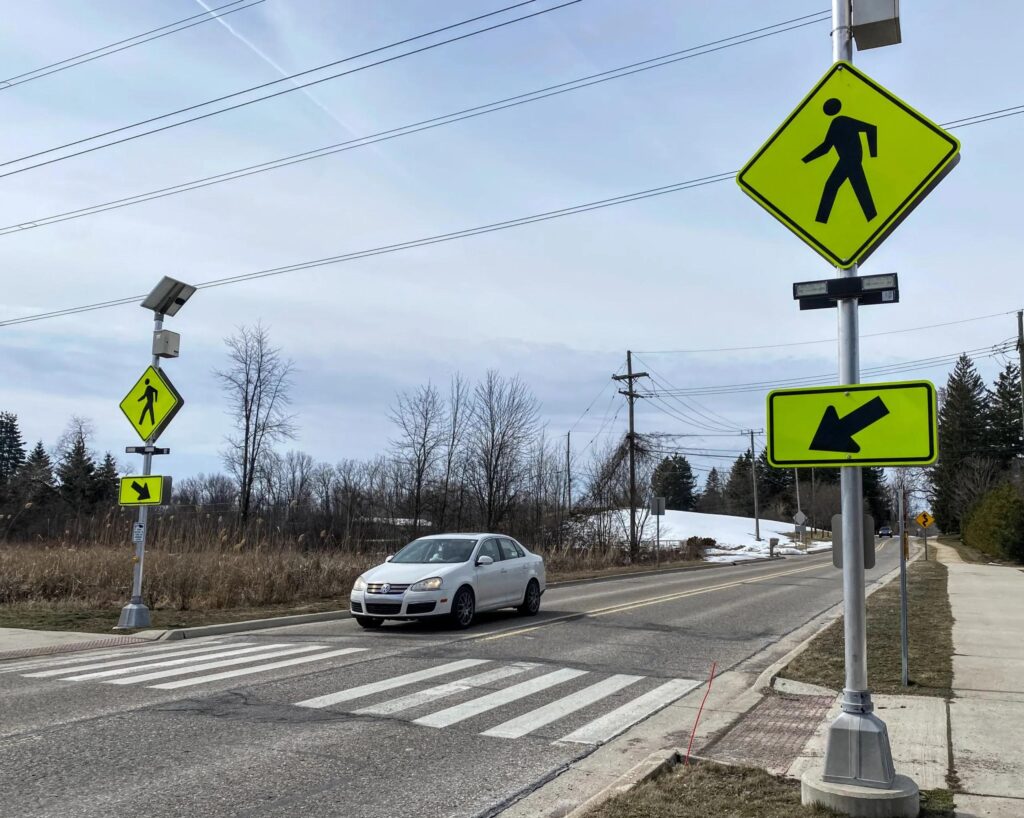
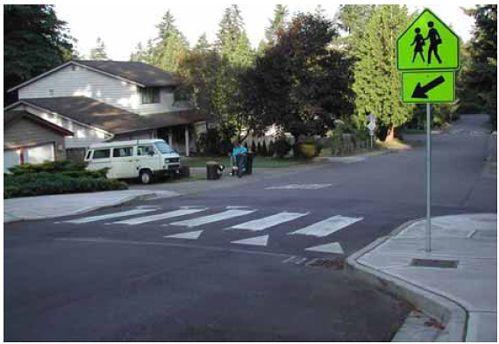
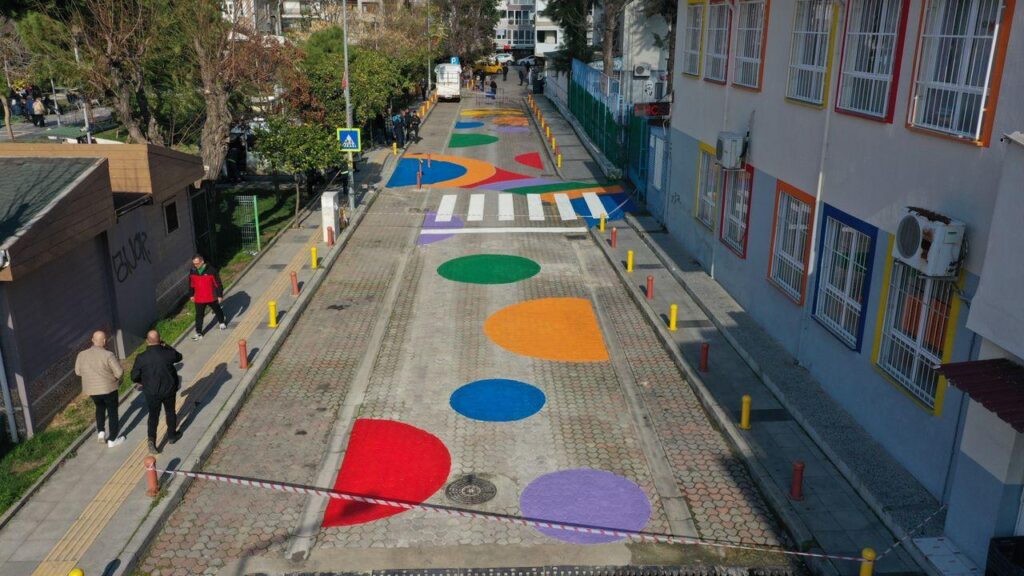
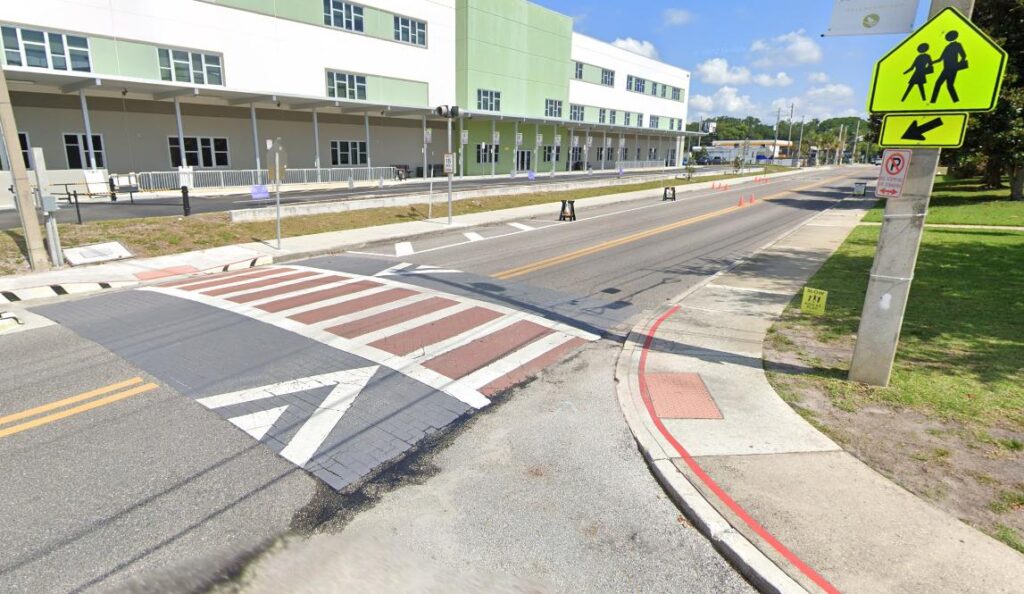
School zones require extra emphasis on safety and visibility.
Key objectives:
- Lower speeds during school hours
- Improve pedestrian crossings
- Increase driver awareness
Common measures:
- Raised crosswalks
- Flashing speed signs
- High-visibility pavement markings
Urban & Mixed-Use Areas
In commercial or mixed-use corridors, traffic calming helps:
- Support walkability
- Improve retail accessibility
- Balance traffic flow with pedestrian activity
Common Traffic Calming Strategies
Traffic calming measures generally fall into three categories:
- Vertical deflection (forces vehicles to slow down physically)
- Horizontal deflection (changes alignment)
- Visual/psychological measures (influences driver perception)
Vertical Deflection Measures
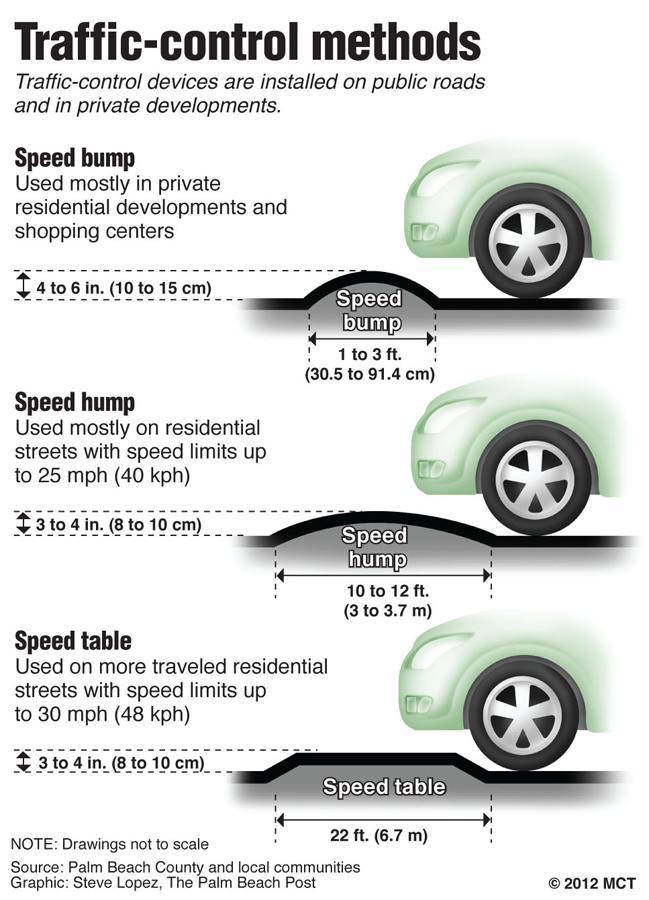
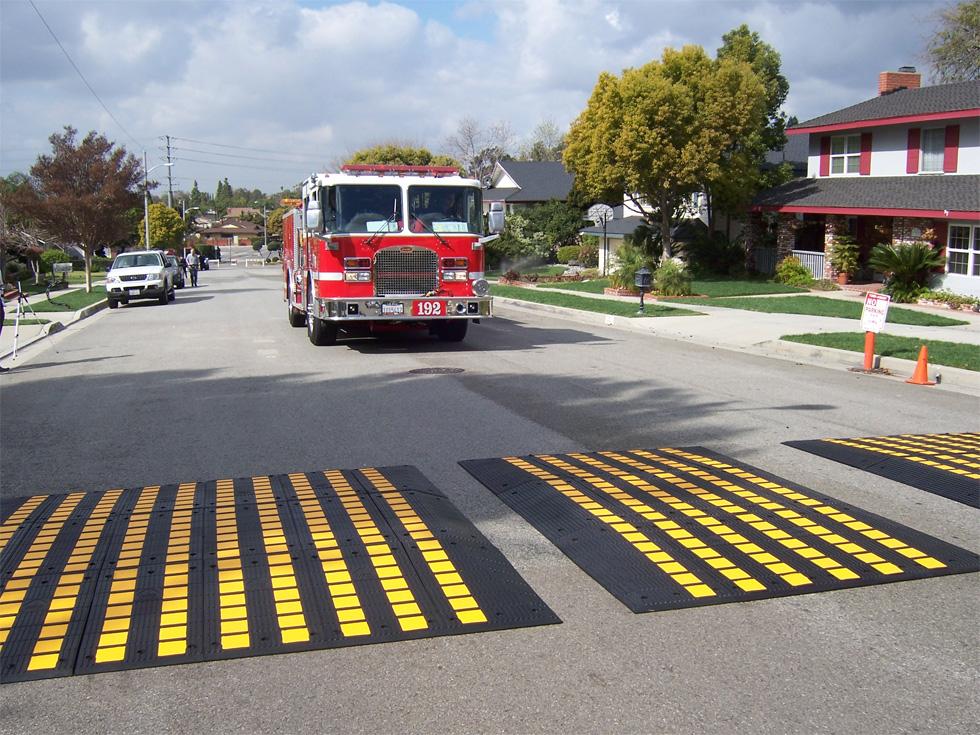
These are the most direct and effective ways to reduce speed.
Speed Humps
- Short, rounded bumps
- Typically reduce speeds to 15–25 km/h
Speed Tables
- Longer, flatter surfaces
- More comfortable for vehicles
- Often used at crossings
Raised Crosswalks / Intersections
- Combine pedestrian safety with speed reduction
- Improve visibility and accessibility
Horizontal Deflection Measures
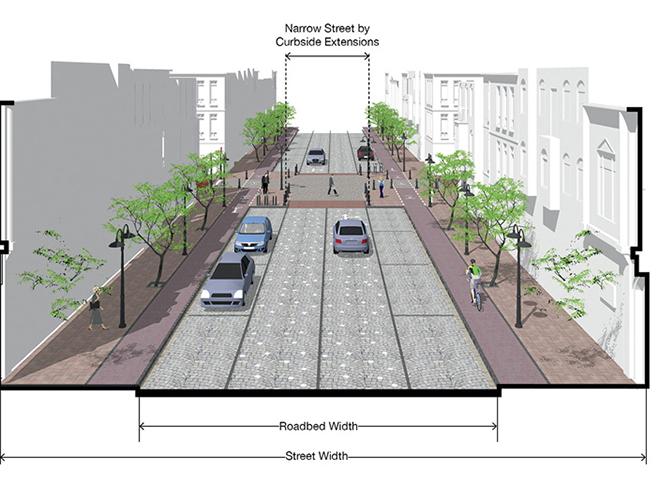
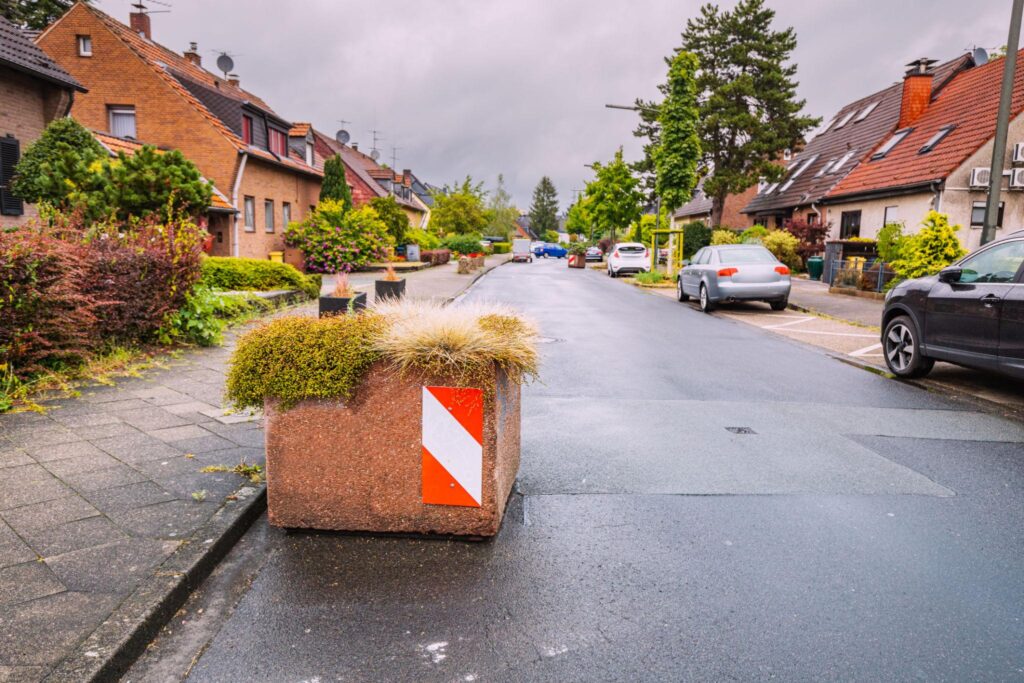
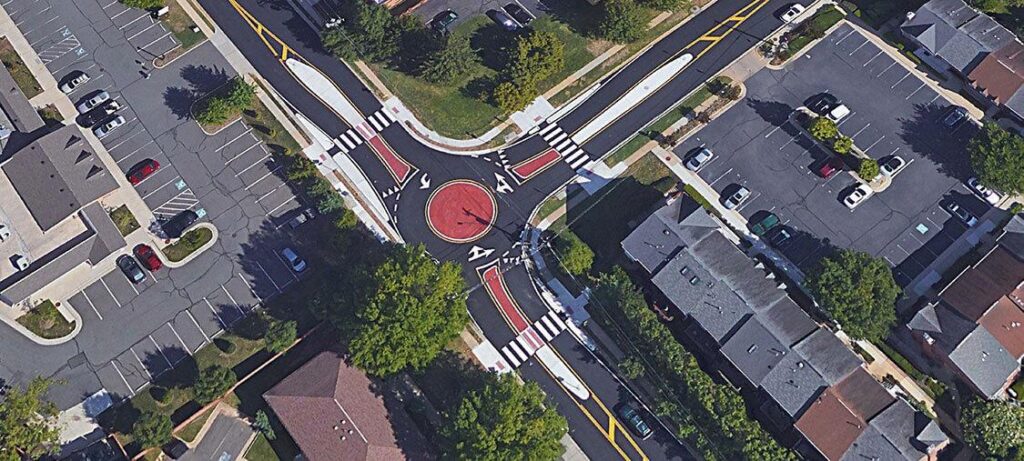
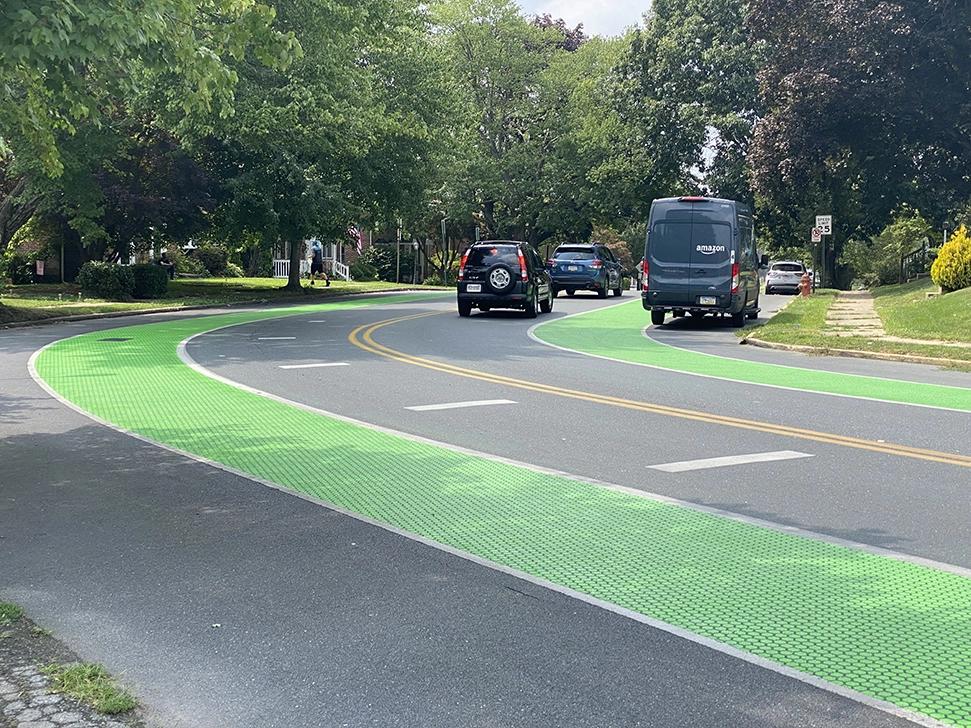
These measures force drivers to slow down by altering their path.
Chicanes
- Alternating curb extensions
- Create a winding travel path
Curb Extensions (Bulb-outs)
- Reduce crossing distance for pedestrians
- Narrow the roadway visually
Mini Roundabouts
- Replace stop-controlled intersections
- Reduce conflict severity and speeds
Visual & Psychological Measures
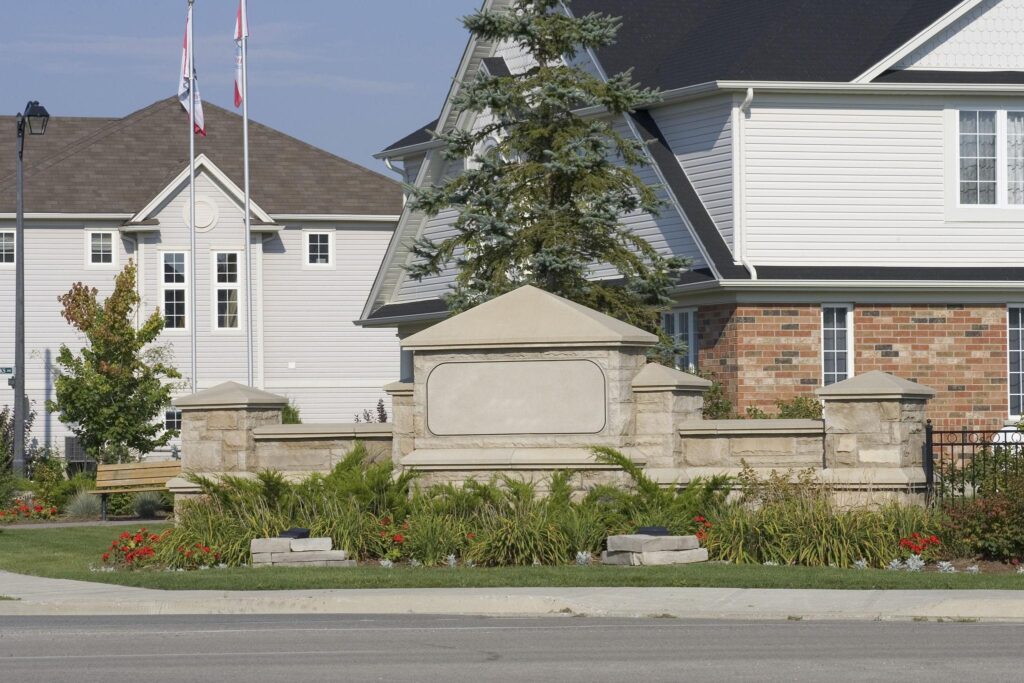
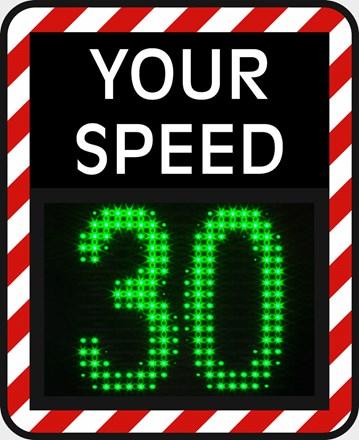
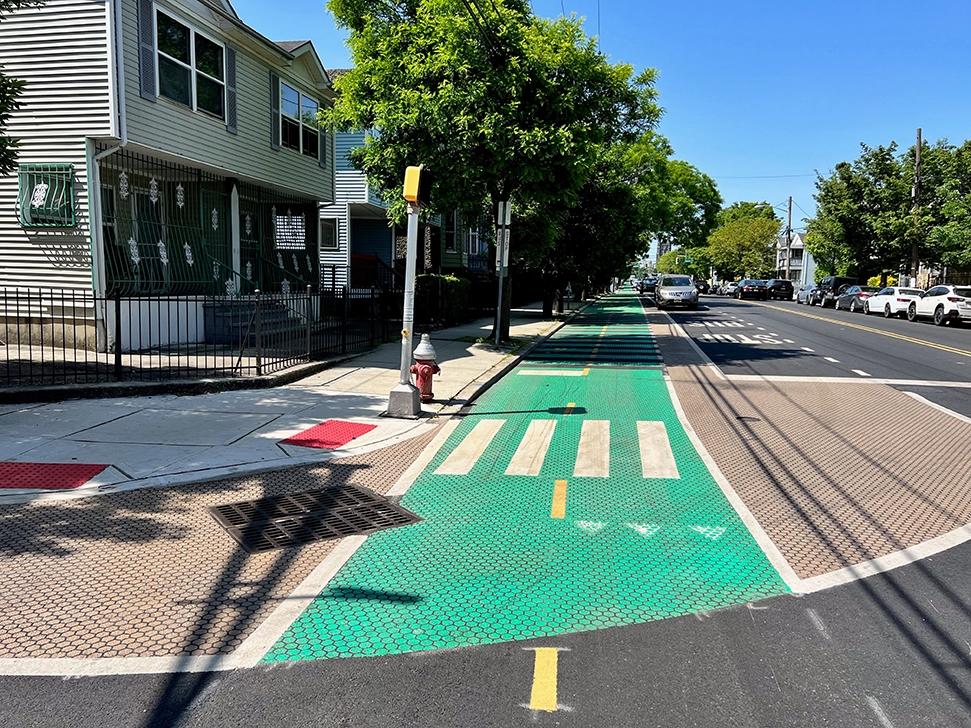
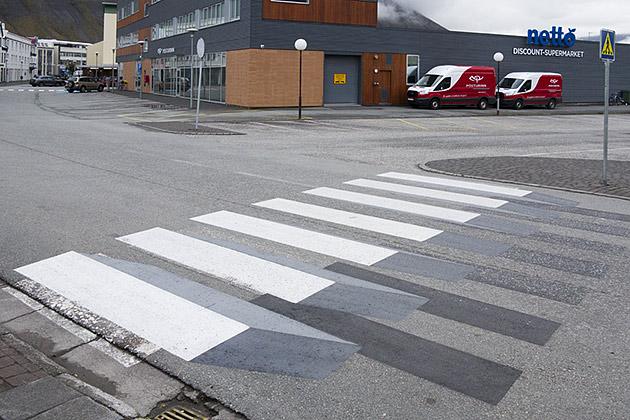
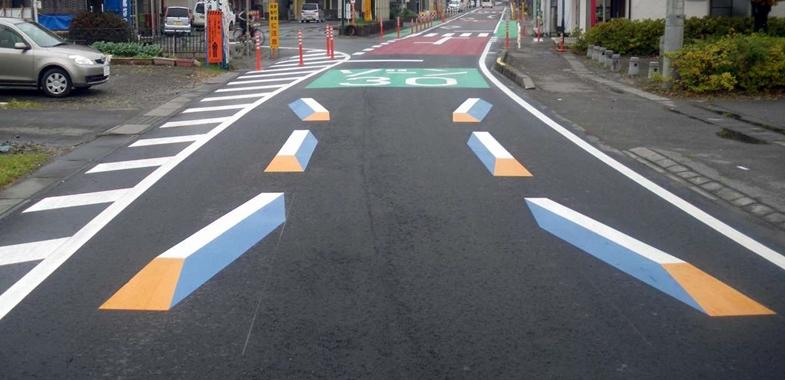
These rely on driver perception rather than physical barriers.
Pavement Markings
- Lane narrowing
- Edge lines
- Textured or colored surfaces
Speed Feedback Signs
- Display real-time speed to drivers
- Proven to reduce speeding behavior
Gateway Treatments
- Entry features to signal transition into slower zones
- Signs, pavement color changes, landscaping
Choosing the Right Traffic Calming Strategy
Effective calming requires:
- Understanding traffic volumes and patterns
- Identifying key safety issues
- Matching solutions to context (residential vs school vs urban)
Not every measure works everywhere.
For example:
- Speed humps may not suit emergency routes
- Visual measures alone may not work on high-speed roads
The best results come from a combination of measures, not a single intervention.
How Effective Are Traffic Calming Measures?
While traffic calming strategies are widely used, their effectiveness can vary depending on roadway conditions, traffic volumes, and surrounding land use.
That said, industry guidance from organizations like ITE, NACTO, and FHWA provides typical observed ranges for speed reduction.
Typical Speed Reduction by Measure
| Measure | Typical Speed Reduction | Notes |
|---|---|---|
| Speed Humps | 20–40% | Most effective on local streets; strong vertical deflection |
| Speed Tables | 15–30% | Smoother profile; suitable for bus routes and crossings |
| Raised Crosswalks | 15–25% | Combines pedestrian safety with speed control |
| Chicanes | 10–25% | Requires sufficient right-of-way; effective visually + physically |
| Curb Extensions (Bulb-outs) | 5–15% | More effective when combined with other measures |
| Lane Narrowing / Road Diets | 5–20% | Works well in urban or constrained corridors |
| Speed Feedback Signs | 3–10% | Behavior-based; effectiveness may diminish over time |
| Pavement Markings / Visual Treatments | 2–10% | Low-cost, but typically lower impact alone |
| Mini Roundabouts | 15–30% | Reduces both speed and conflict severity |
Combined Measures: What Actually Works Best
In practice, traffic calming measures are rarely implemented in isolation. The most effective strategies combine multiple treatments:
- Vertical + Horizontal Deflection
→ High impact: typically 25–50% speed reduction - Vertical Measures Only (e.g., speed humps/tables)
→ Moderate to high impact - Horizontal + Visual Measures
→ Moderate impact, especially in constrained corridors - Visual Measures Only
→ Low to moderate impact, best used as supporting treatments - Full Corridor Treatments (multiple interventions along a street)
→ Most effective for sustained speed reduction and behavior change
Important Considerations
- These values represent typical observed ranges, not guaranteed outcomes
- Effectiveness depends on:
- Existing speed conditions
- Road geometry and width
- Traffic volumes and composition
- Driver familiarity over time
- Some measures (especially signs and markings) may experience reduced effectiveness over time without reinforcement
Practical Takeaway
For most residential streets and school zones, a combination of vertical and horizontal measures provides the most reliable and sustained speed reduction.
Single treatments can help, but coordinated, corridor-level strategies consistently deliver better results.