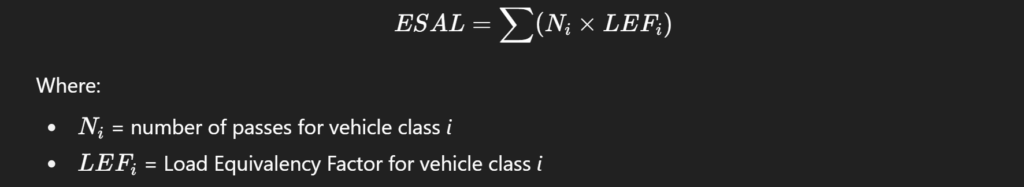
The ITE Trip Generation Manual 12th Edition provides both fitted curve equations and average trip rates for estimating trip generation. However, not all datasets are equally reliable. In many cases, there is either limited data points, or no equation provided. When preparing traffic impact studies for such land uses, engineers and planners must decide:
Should I use the regression equation, the average rate, or neither?
ITE provides a structured approach for this decision, but it’s often misunderstood or overlooked. This article breaks down that process into clear, practical guidance you can apply in real projects.
The Two Main Trip Generation Methods
Before choosing, it’s important to understand the two primary options:
Fitted Curve Equation
- A regression-based relationship (e.g., trips vs GFA)
- More responsive to scale
- Requires strong, reliable data
ITE recommends using the fitted curve only when the data is strong enough.
Weighted Average Rate
- Average trips per unit (e.g., trips per 1,000 sqft)
- Simpler and more stable
- Less sensitive to poor data quality
If the regression is weak or unavailable, ITE recommends using the average rate.
Use the fitted curve if:
- The dataset includes at least 20 data points
OR - ALL of the following conditions are met:
- R² ≥ 0.75
(R², or “R-squared,” is a measure of how well the equation fits the data. A value of 0.75 means the equation explains about 75% of the variation in trips, so the relationship between building size and trips is fairly strong.) - The curve reasonably fits within the data cluster
- The weighted standard deviation is more than 55% of the weighted average rate
(Standard deviation measures how spread out the data points are. For example, if similar-sized warehouses generate very different numbers of trips, the data has high variability, making a curve more appropriate than a single average.)
- R² ≥ 0.75
Simplified:
- 20+ data points → statistically reliable dataset
- High R² (≥ 0.75) → strong correlation
- Curve within data cluster → visually makes sense
- High variability (>55%) → data is spread out, so a curve is more appropriate than a single average
Use the equation when the dataset is large or shows a clear trend with significant variation.
Use the weighted average rate if:
- There are at least 3 data points (preferably 6+)
- R² < 0.75 or no equation is provided
- Weighted standard deviation is less than 55% of the average rate
- The average line falls within the data cluster
Simplified:
- Few data points → regression is unreliable
- Low R² → weak relationship
- Low variability (<55%) → data points are clustered → average works well

Use the average rate when the data is limited but relatively consistent.
How to Use ITE Trip Generation Rate Ranges
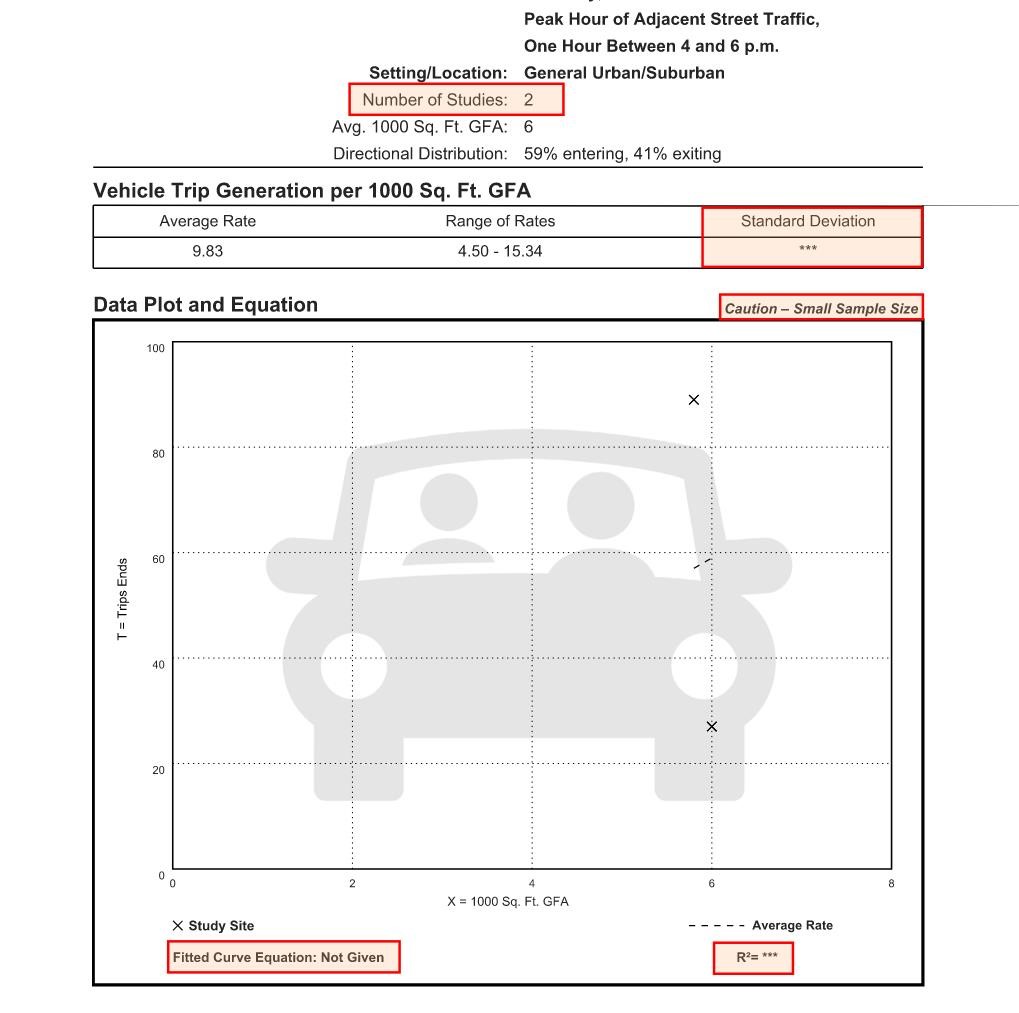
The ITE Trip Generation Manual 12th Edition often provides a range of observed trip rates (minimum to maximum).
This range reflects how much trip generation varies across real sites, it is not intended as a value selection tool.
When and How to Use the Range
Use the range to:
- Understand variability in the data
- Present low, typical, and high scenarios for large or uncertain projects
- Support engineering judgment when site conditions justify being toward one end
Avoid Selecting the lowest (or midpoint) value simply to reduce impacts
Instead:
- Use the average rate or fitted curve as your primary estimate
- Use the range for context or sensitivity analysis
- Clearly justify any deviation based on site conditions
Key takeaway: The rate range is for context and transparency, not cherry-picking numbers.
When Should You NOT Rely on ITE Data?
Sometimes, neither method is appropriate.
Collect local trip generation data or use alternative methods if:
- The site does not match the ITE land use definition
- There are only 1–2 data points (or very few overall)
- Weighted standard deviation is greater than 55% (high variability + weak reliability)
- Your site size is outside the range of the dataset
- Neither the curve nor average line fits within the data cluster
These situations indicate that the ITE dataset is not representative of your project
Common examples:
- Large logistics/warehouse campuses
- Unique or hybrid land uses
- Urban or mixed-use developments
- Sites with unusual operating patterns (e.g., shift-based traffic)
The “55% Rule”
This is one of the most misunderstood parts. Here is a simplified explanation:
- Compare:
- Weighted standard deviation
- Weighted average rate
Interpretation:
- < 55% → data is tightly grouped → average is reliable
- > 55% → data is widely spread → average is unreliable → consider regression or alternatives
Low variability → use average
High variability → use curve (if valid) or rethink approach
How ITE recommends doing Trip Generation with limited data
Here’s how to apply this quickly in practice:
- Check number of data points
- <3 → don’t rely on ITE
- 3–20 → proceed with caution
- 20+ → good candidate for regression
- Check R²
- ≥ 0.75 → acceptable
- < 0.75 → avoid equation
- Check variability (55% rule)
- Low → use average
- High → use curve (if valid)
- Check visual fit
- Does the line/curve actually match the data?
- Check applicability
- Does your site match the land use and data range?
Common Trip Generation Mistakes to Avoid
- ❌ Using regression equations with low R²
- ❌ Ignoring the number of data points
- ❌ Applying ITE data outside its range
- ❌ Not checking whether the line/curve fits the data
- ❌ Treating results as precise instead of approximate
The ITE Trip Generation Manual is not a plug-and-play tool.
It requires:
- Careful interpretation of data quality
- Selection of the appropriate method
- Application of engineering judgment
The goal is not just to produce a number, but to produce a defensible estimate.
Need Help with Trip Generation?
When ITE data is limited or unclear, developing defensible estimates can be challenging.
Arterials provides fast, reliable trip generation reports using industry best practices and project-specific judgment.
Get a professional, submission-ready report within 24–48 hours. Describe your project using the form below and we will get back to you shortly.
Frequently Asked Questions (FAQ)
What should I do if no ITE equation is provided?
Use the weighted average trip rate, provided there are enough data points and the data is reasonably consistent.
When is R² too low to use a fitted curve?
Generally, if R² is less than 0.75, the equation should be used with caution or avoided.
What is R²?
R² indicates how well the equation fits the data, higher values mean a stronger relationship between site size and trips.
What does standard deviation mean in trip generation?
It measures how much trip rates vary between sites, higher variation means less reliability in using a single average.
When should I avoid using ITE data altogether?
When there are very few data points, poor fit, or the site does not match the land use definition.
Can I use the lowest value from the ITE rate range?
Not without justification, selecting low values to minimize impacts is not considered best practice.
Should I use average rate or fitted curve?
Use the fitted curve when data is strong and reliable; otherwise, use the average rate.
What if my site is outside the ITE data range?
ITE data may not be applicable. Consider local data or alternative methods.
Is ITE trip generation precise?
No. ITE provides estimates based on observed data, not exact predictions.
Do reviewers check how trip generation was calculated?
Yes. methodology and assumptions are often reviewed as closely as the results. Trip Generation is a major part of the Traffic Impact Study Guidelines.