If you already work with trip generation, you know the headline challenge in many Traffic Impact Studies (TIS/TIA): not all site trips are “new” to the network. Some are simply siphoned from vehicles already passing by. Getting this right can change turn lane warrants, signal timing, and mitigation costs.
This guide is a practitioner’s deep-dive into pass-by trips—definitions, step-by-step calculations, examples, sanity checks, and when (and when not) to use them.
Definitions
- Gross (Total) Site Vehicle Trips
Trip ends generated by the land use during the study peak (e.g., PM peak hour of adjacent street). - Internal Capture
Trips between uses within a mixed-use site that never exit to the public street system. - External Trips
Gross trips minus internal capture. These are the trips interacting with the public network. - Pass-By Trips
A subset of external trips made by drivers already on the adjacent roadway who stop at the site on the way to another primary destination. They do enter/exit the site (impacting driveway design), but they are not new to the corridor. - Diverted-Linked Trips
Also a subset of external trips; drivers are in the area but would divert off their path or from a parallel route to visit the site. They can add new load to specific links/intersections between the diversion point and the site. - Primary (New) Trips
External trips that would not be on the adjacent street without the site. These are the net new trips added to the broader network.
Rule of thumb hierarchy for the PM peak hour:
Gross → (subtract internal capture) → External → split into Pass-By, Diverted-Linked, and Primary.
Network “net new” load is Primary + the incremental effects of Diverted-Linked. Driveway design must consider all site-oriented flows: Primary + Diverted-Linked + Pass-By.
Where Pass-By Assumptions Make Sense
Land uses with impulse or convenience behavior and strong frontage exposure typically justify meaningful pass-by:
- Fuel stations / convenience stores
- Coffee/donut drive-throughs
- Quick-service restaurants (QSR), fast casual
- Pharmacies, small format supermarkets
- Small convenience retail on commuter corridors
- Some outparcel pads in shopping centers
Land uses not suited to high pass-by:
- Offices, schools, medical clinics with appointment patterns
- Destination retail (furniture, electronics superstores)
- Gyms with fixed membership peaks (use carefully)
- Residential of any type (no pass-by)
Mixed-use sites: apply pass-by at the component level (e.g., the coffee outparcel of a shopping center), then combine with internal capture carefully to avoid double counting.
Typical Pass-By Behavior (Use Ranges, Not Certainties)
Observed pass-by can vary widely by context, access, visibility, competition, and time of day. Practitioners often use ranges (for sensitivity) such as:
- Fuel/convenience: ~40–70%
- Coffee/donut drive-through: ~40–75%
- QSR / fast casual: ~30–60%
- Pharmacy: ~25–50%
- Small supermarket / mini-mart: ~20–40%
- General retail pad: ~15–35%
Treat these as illustrative ranges for screening. Always check local data, agency guidance, and corridor context.
The Calculation Workflow (Step-by-Step)
Compute Gross Site Trips
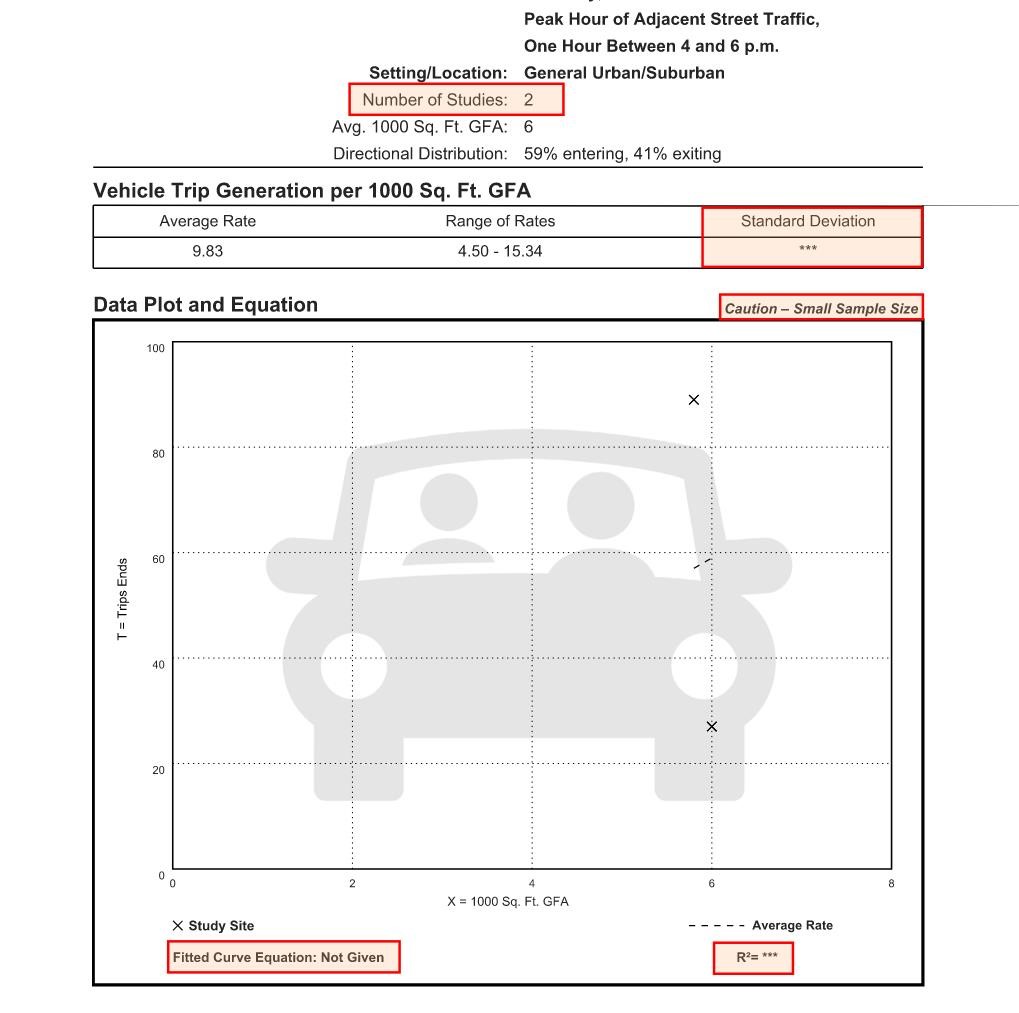
From a credible source (e.g., a trip generation manual or local study), compute gross inbound/outbound trip ends for the relevant analysis peak(s).
Apply Internal Capture (if mixed-use)
Use an accepted internal capture method; subtract captured trips from gross to get External.
Apply Pass-By Percentage to External
Pass-by is a percentage of external trips, not gross. Determine inbound/outbound split of pass-by to align with operations (usually similar to the external split unless a drive-through queue creates asymmetry).
Assign a Diverted-Linked Portion
If diversion from a parallel route or nonadjacent link is likely, identify the affected links/intersections where incremental load appears.
Step 5 — Compute Primary (New) Trips
Primary = External − Pass-By − Diverted-Linked (if explicitly separated).
Network vs Driveway Accounting
- Network (links/intersections beyond the frontage): add Primary trips (plus any incremental effects of Diverted-Linked on the affected approaches).
- Driveways and immediate frontage intersections: include all site-oriented flows (Primary + Pass-By + Diverted-Linked).
Worked Examples (Fully Numeric)
Example A — Coffee Drive-Through Outparcel (Illustrative)
Assumptions (PM peak hour):
- Gross trips: 180 (55% in / 45% out → 99 in / 81 out)
- Stand-alone, no internal capture
- Pass-by rate: 60% of external
- No diverted-linked modeled separately
Calculations:
- External = 180 (no internal capture)
- Pass-By = 0.60 × 180 = 108 trips (≈ 59 in / 49 out using 55/45 split)
- Primary = External − Pass-By = 180 − 108 = 72 (≈ 40 in / 32 out)
What you assign where?
- Driveways: design for all site-oriented flows = 180 trips total (99 in / 81 out).
- Wider network: add Primary only = 72 trips total (≈ 40 in / 32 out).
Sanity check: Is 108 pass-by plausible given through traffic on the frontage?
Example B — Pharmacy with Small Grocery
Assumptions (PM peak hour):
- Gross trips: 140 (50/50 split → 70 in / 70 out)
- Mixed-use with adjacent strip retail; internal capture = 10% of gross = 14
- External = 140 − 14 = 126
- Pass-by rate = 40% of external = 50 (approx)
- Diverted-linked = 10% of external = 13
- Primary = 126 − 50 − 13 = 63
Assignments:
- Driveways: 140 total (all site-oriented flows still enter/exit).
- Network: Primary 63 added where they distribute; add diverted-linked only to specific approaches where the diversion occurs.
Example C — Gas/Convenience on Two Frontages (Corner Lot)
Assumptions (PM):
- Gross = 220 (60% in / 40% out → 132 in / 88 out)
- Internal capture = 0
- Pass-by = 50% of external = 110
- Two frontages: 60% of traffic on Arterial A, 40% on Collector B.
- Two driveways on A, one on B. Directional splits per frontage follow traffic patterns.
Key moves:
- Split the pass-by by frontage proportion (e.g., 66 pass-by on A, 44 on B), then by inbound/outbound and by driveway (based on access preference and turning movement feasibility).
- Network adds only Primary (110), distributed to both frontages; Driveways sum to 220.
Critical Sanity Checks (Don’t Skip These)
- Pass-By Cannot Exceed What the Corridor Can Supply
Your inbound pass-by must be credible relative to the directional through-traffic on the adjacent approach during the same peak. A quick cap:- Estimate the market capture share of passing vehicles likely to stop (by use and frontage conditions).
- Ensure inbound pass-by ≤ (Directional through volume × plausible capture share × feasible turning share).
- Some Departments limit pass-by trips to a maximum of 10% of the adjacent street traffic.
- Don’t Double Count with Internal Capture
Internal capture is removed before applying pass-by. Never apply pass-by to gross. - Mind the Peak Hour Alignment
Use the same hour for site trips and adjacent street volumes (e.g., PM peak of adjacent street). Some land uses peak off-offset (coffee AM vs PM). Calibrate accordingly. - Turn Feasibility and Access Constraints
A median restricting left turns? Then inbound pass-by from that direction is not available unless a U-turn path exists and is accounted for. - Context Sensitivity
First-to-market in a low-traffic corridor? Your pass-by should be conservative. Overstating it can understate mitigation. - Directional Balance
Don’t assume symmetric pass-by if the corridor is highly directional (commute flows, one-sided draw of land uses). - Multi-Driveway Consistency
Sum of movements across driveways must reconcile to the site totals. Check that turning movement percentages are consistent with geometry and driver behavior. - Document Assumptions Clearly
State sources, percentages, splits, and caps. Provide a short rationale (competition, sightlines, speed environment, access, median control).
Assignment and Operations: Practical Tips
- Driveway Analysis:
Use the full site-oriented flows (including pass-by) to size throat lengths, turn lanes, and to evaluate blocking/queue spillback. - Frontage Intersections:
Include pass-by at the nearest intersection if it changes turn movement volumes materially (because pass-by still turns at that intersection). Just remember that these vehicles are already in the through stream—you are reshaping turning proportions more than you are creating net new through volume. - Beyond the Immediate Frontage:
Drop pass-by; carry Primary (and any diverted-linked increments) only.
Common Pitfalls and How to Avoid Them
- Applying pass-by to residential/office uses. Don’t.
- Using one pass-by percentage across all times of day. Coffee AM ≠ PM.
- Ignoring medians or access restrictions that limit feasible turns.
- Over-aggressive pass-by in a low-volume corridor. Cap it based on available through traffic.
- Double counting (pass-by on top of gross or before internal capture).
- Not distinguishing diverted-linked (leads to wrong intersection loading on diversion paths).
Sensitivity Testing (Show Your Work)
For review transparency, run Low / Central / High pass-by cases. Example for a coffee site:
- Low: 45%
- Central: 60%
- High: 70%
Summarize how each case affects:
- Driveway volume and turn lane needs
- Frontage intersection LOS and queues
- Off-site mitigation thresholds (turn lanes, storage, signal timing)
This helps clients and reviewers understand risk bands and choose conservative designs where needed.
Documentation Template (Copy/Paste Outline)
Assumptions
- Land use and size:
- Peak hour analyzed:
- Trip generation source and rate:
- In/Out split:
- Internal capture (method and %):
- Pass-by (basis, % by time period):
- Diverted-linked (if used, basis and affected links):
- Directional distribution:
- Driveway allocation and turning splits:
- Frontage traffic volumes and any pass-by cap check:
Results
- Gross trips (In/Out)
- External trips
- Pass-by trips (In/Out)
- Diverted-linked trips (In/Out)
- Primary (net new) trips (In/Out)
- Driveway totals (by driveway and movement)
- Network assignments (where applicable)
Sanity Checks
- Pass-by cap vs available through volume
- Access constraints (medians, U-turns)
- Consistency across driveways/intersections
Quick Excel Formulas (Illustrative)
Let:
G= Gross trips (veh/hr)IC%= Internal capture % of grossPB%= Pass-by % of externalDL%= Diverted-linked % of external
Then:
External = G * (1 − IC%)PassBy = External * PB%DivLinked = External * DL%Primary = External − PassBy − DivLinked
For inbound/outbound splits, multiply each by the respective percentage.
Review Checklist (for You or the Approver)
- Land use and context justify pass-by
- Pass-by applied to external, not gross
- Time-of-day consistent for trips and volumes
- Directional and turning feasibility checked
- Pass-by inbound capped by plausible capture from frontage volumes
- Mixed-use: internal capture done before pass-by
- Diverted-linked handled explicitly (if relevant)
- Driveway vs network accounting kept distinct
- Sensitivity analysis included
- All inputs/sources documented
Final Thoughts
Pass-by can be your friend or your trap. Used thoughtfully, with context, caps, and clear documentation, it can right-size mitigations and prevent over-design. Used casually, it can mask real impacts or invite redesign late in approvals.